System Operation
How we keep the NTS operating safely – every day
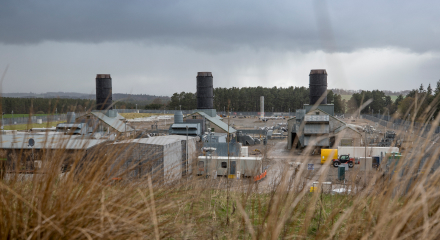
As System Operator, National Gas is responsible for keeping the National Transmission System (NTS) operating safely, reliably and efficiently. That means balancing supply and demand on the network and ensuring safe operating pressures are maintained within the pipes. Our National Control Centre uses a range of tools and strategies to operate the NTS safely, reliably and efficiently every day.
The role of gas shippers
Gas shippers are the principal users of the NTS. They buy gas from producers and sell it on to gas suppliers. They use the NTS to transport the gas between these two players. Find out how gas shippers book entry and exit capacity on the NTS.
Shippers are incentivised to ensure that the volume of gas they put into the system is the same as the volume they take out each ‘gas day’ (starting at 5am and ending at 5am the following day). However, imbalances do often occur for a whole variety of reasons – from weather conditions to unpredictable demand from domestic consumers. An imbalance of supply and demand on the NTS can cause pressure issues across the network or in specific locations.
Our role as System Operator: residual balancing
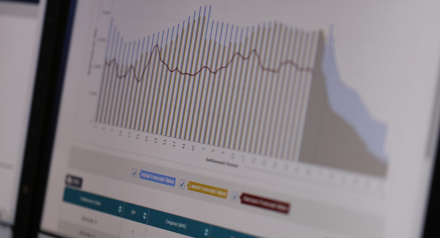
That’s when National Gas steps in as System Operator, to act as the ‘residual balancer’ of the network. Each day, our National Control Centre monitors the NTS linepack (the amount of gas in the pipes) and can take action to keep this within acceptable limits (where an end-of-day supply and demand balance is considered unlikely). We have several tools at our disposal to help us achieve this, which include:
- We can make energy balancing trades on the On-the-day Commodity Market (OCM). Here we buy gas with the aim of increasing NTS linepack (a short system) or sell gas with the aim of reducing NTS linepack (a long system).
- We can issue Margins Notices (MNs) and/or Gas Balancing Notifications (GBNs) to inform NTS users of a potential or actual supply/demand imbalance on the network. These notices aim to influence market participants to quickly take corrective actions.
- We can use Demand-Side Response (DSR), including DSR contracts with major gas users. In the event of a forecast or actual under-supply of gas on the NTS, we may request DSR offers to be submitted and/or instruct organisations to reduce their demand via DSR contracts.
- We hold Operating Margins (OM) gas in reserve, which can be released onto the network at short notice. We only use OM gas on rare occasions to maintain NTS pressures immediately after operational stresses, before other market-balancing measures take effect.
- If all these measures fail to return the system to acceptable operating levels, we can ask the Network Emergency Coordinator (NEC) to declare a Network Gas Supply Emergency (NGSE). In an emergency, instead of trying to influence the market, we take a command-and-control approach to bring the system back into balance.
Find out more about how we operate the National Transmission System (NTS):
Market Change
Find out how our Market Change Delivery team develops, negotiates and implements changes related to commercial contracts.
Capabilities & methodologies
Learn about our core capabilities and strategies for operating the gas National Transmission System (NTS)
Find out more
Unaccounted for gas (UAG)
How we investigate the causes of unaccounted-for gas in the NTS.
Safety Monitors
How we define the levels of gas required in storage through the winter period.
Find out more